With natural hazard and climate-related disasters on the rise, online tools such as crowdsourced mapping and social media can help people understand and respond to a crisis. They enable people to share their location and contribute information.
But are these tools useful for everyone, or are some people marginalised? It is vital these tools include information provided from all sections of a community at risk.
Current evidence suggests that is not always the case.
Online tools let people help in disasters
Social media played an important role in coordinating response to the 2019 Queensland floods and the 2013 Tasmania bushfires. Community members used Facebook to coordinate sharing of resources such as food and water.
Crowdsourced mapping helped in response to the humanitarian crisis after the 2010 Haiti earthquake. Some of the most useful information came from public contributions.
Twitter provided similar critical insights during Hurricane Irma in South Florida in 2017.
In the rush to develop new disaster mitigation tools, it is important to consider whether they will help or harm the people most vulnerable in a disaster.
Who is vulnerable?
Extreme natural events, such as earthquakes and bushfires, are not considered disasters until vulnerable people are exposed to the hazard.
To determine people’s level of vulnerability we need to know:
the level of individual and community exposure to a physical threat
their access to resources that affect their capacity to cope when threats materialise.
Some groups in society will be more vulnerable to disaster than others. This includes people with immobility issues, caring roles, or limited access to resources such as money, information or support networks.
When disaster strikes, the pressure on some groups is often magnified.
The devastating scenes in New Orleans after Hurricane Katrina in 2005 and in Puerto Rico after Hurricane Maria in 2017 revealed the vulnerability of children in such disasters.
Unfortunately, emergency management can exacerbate the vulnerability of marginalised groups. For example, a US study last year showed that in the years after disasters, wealth increased for white people and declined for people of colour. The authors suggest this is linked to inequitable distribution of emergency and redevelopment aid.
We need to ask: do new forms of disaster response help everyone in a community, or do they reproduce existing power imbalances?
Unequal access to digital technologies
Research has assessed the “techno-optimism” – a belief that technologies will solve our problems – associated with people using online tools to share information for disaster management.
These technologies inherently discriminate if access to them discriminates.
In Australia, the digital divide remains largely unchanged in recent years. In 2016-17 nearly 1.3 million households had no internet connection.
Lower digital inclusion is seen in already vulnerable groups, including the unemployed, migrants and the elderly.
Global internet penetration rates show uneven access between economically poorer parts of the world, such as Africa and Asia, and wealthier Western regions.
Representations of communities are skewed on the internet. Particular groups participate with varying degrees on social media and in crowdsourcing activities. For example, some ethnic minorities have poorer internet access than other groups even in the same country.
Research shows participation biases in community mapping activities towards older, more affluent men.
Protect the vulnerable
Persecuted minorities, including LGBTIQ communities and religious minorities, are often more vulnerable in disasters. Digital technologies, which expose people’s identities and fail to protect privacy, might increase that vulnerability.
Unequal participation means those who can participate may become further empowered, with more access to information and resources. As a result, gaps between privileged and marginalised people grow wider.
For example, local Kreyòl-speaking Haitians from poorer neighbourhoods contributed information via SMS for use on crowdsourced maps during the 2010 Haiti earthquake response.
But the information was translated and mapped in English for Western humanitarians. As they didn’t speak English, vulnerable Haitians were further marginalised by being unable to directly use and benefit from maps resulting from their own contributions.
Any power imbalances that come from unequal online participation are pertinent to disaster risk reduction. They can amplify community tensions, social divides and marginalisation, and exacerbate vulnerability and risk.
With greater access to the benefits of online tools, and improved representation of diverse and marginalised people, we can better understand societies and reduce disaster impacts.
We must remain acutely aware of digital divides and participation biases. We must continually consider how these technologies can better include, value and elevate marginalised groups.
High quality and up-to-date maps and geographic information at appropriate spatial scales are vital for effectively preparing for and responding to disasters and humanitarian crises. Risk reduction activities, resource and service delivery, rescue and emergency care, information flows and risk communication, impact assessments and disaster recovery are all dependent on spatial information. In some parts of the world national/government maps, and even Google maps, are inadequate or incomplete, and alternative maps are required.
Public participation in mapping for disaster response and humanitarian crises has increased significantly in the last decade. Sometimes referred to as digital humanitarianism or digital volunteering, or more broadly volunteered geographic information (VGI), the practices of private citizens contributing geographic information for crisis management has been facilitated by technological advancements such as broadband internet and Web 2.0, cloud storage, GPS and smartphones.
Despite limitations, including digital divides and unequal online participation, and data quality concerns, among others, VGI has provided highly useful maps and geographic information to aid in a variety of humanitarian crises, with the use of OpenStreetMap in response to earthquakes in Haiti (2010) and Nepal (2015) as key examples.
What is a mapathon?
OpenStreetMap (OSM) is an online, crowdsourced mapping platform – a bit like Google Maps but created by people like you! Volunteers work independently or collaboratively to add and edit content on the global digital map.
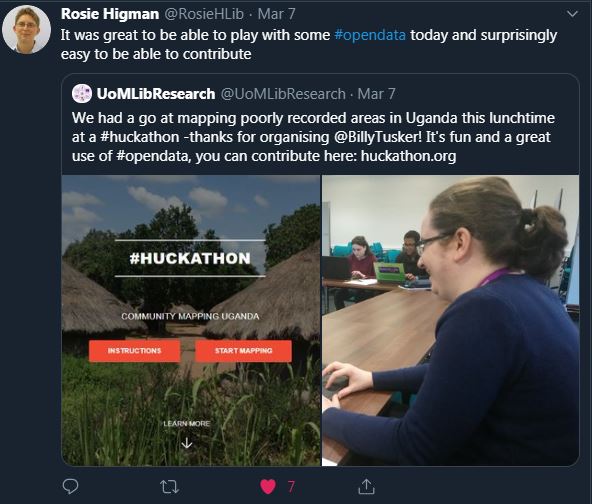
Huts and villages in Uganda being mapped on OpenStreetMapA mapathon is a bit like a ‘mapping party’, whereby people come together to complete a whole load of OSM mapping in a relatively short period of time. The idea being that with everyone working together in just a few hours we can make a BIG contribution! Importantly, mapathons are usually accompanied by free pizza and other fun snacks for the volunteers!
Volunteers work together to add features to poorly-mapped regions
The HCRI humanitarian mapathon
In March 2019 we held our annual mapathon in the Humanitarian and Conflict Response Institute (HCRI), University of Manchester. With colleagues in Geography, we were aiming to contribute to an ongoing project coordinated by Dr Jonny Huck seeking to improve delivery of healthcare and prosthetic limbs to people who were mutilated during conflict in North Uganda. The mapping involved tracing basic information, such as people’s homes, on satellite photographs.
No mapathon is complete without pizza!Around 40 students, academic and support staff from HCRI and across the university volunteered to contribute ~20,000 features (roads, huts, buildings etc) to the poorly mapped region of Acholi in Uganda (Wow!). This open source mapping and data will directly help in reaching people with urgently needed healthcare.
The HCRI humanitarian mapathon, University of Manchester, 2019
Mapping is also valuable to volunteers
“The mapathon was a great way to engage with people who have varying levels of map/geographic information systems (GIS) experience. The process of mapping roads, houses, tracks, buildings etc was very simple. The handouts of how to complete the tasks meant that it was straightforward and you constantly have a source to refer back to. The project as a whole meant that the time I gave felt worthwhile and like I was really making a difference to medical logistic teams in Uganda. I would highly recommend anyone to come along to the next event and get involved; it’s a great way to spend a couple of hours.” – Rach, HCRI MSc student.
“I think it was particularly useful for students of GIS and disasters, in which we critically analysed VGI to participate in the very digital volunteerism we were analysing. It was a more visceral and tangible demonstration of the quirks of geographic information that we were discussing in class (e.g. map projections) even if these particular quirks were relatively trivial. It was nice to bring together people who I’d never seen before across the school and get a feel for what a larger group VGI volunteering effort looks like. I think a lot of people got a fair bit out of it, and I left the event feeling good. The software is super simple and easy to learn and having a few skilled people there to help when problems arose was enough to get everybody up and running.”
– Mike, HCRI MSc student.
Mapathons are enjoyable and rewarding for volunteers
Get involved!
YOU can contribute too!
You don’t need any prior mapping experience, just a computer and an internet connection, and you can map anytime. Visit http://huckathon.org/ to learn more about the North Uganda project and start mapping! Each feature you add to the map could mean a new limb for someone who has been injured by conflict. Better still; why not host your own mapathon?!
The HCRI mapathon was funded by the School of Arts, Languages and Cultures (SALC) Social Responsibility and Cultural Engagement fund, University of Manchester.
This post is a summary of a paper I had published recently in Geography Compass. The paper is titled A Review of Volunteered Geographic Information for Disaster Management and is co-authored with Dr Eleanor Bruce from the University of Sydney. Here is the citation and link to the full text article:
VGI in disaster management – image courtesy of Billy Haworth
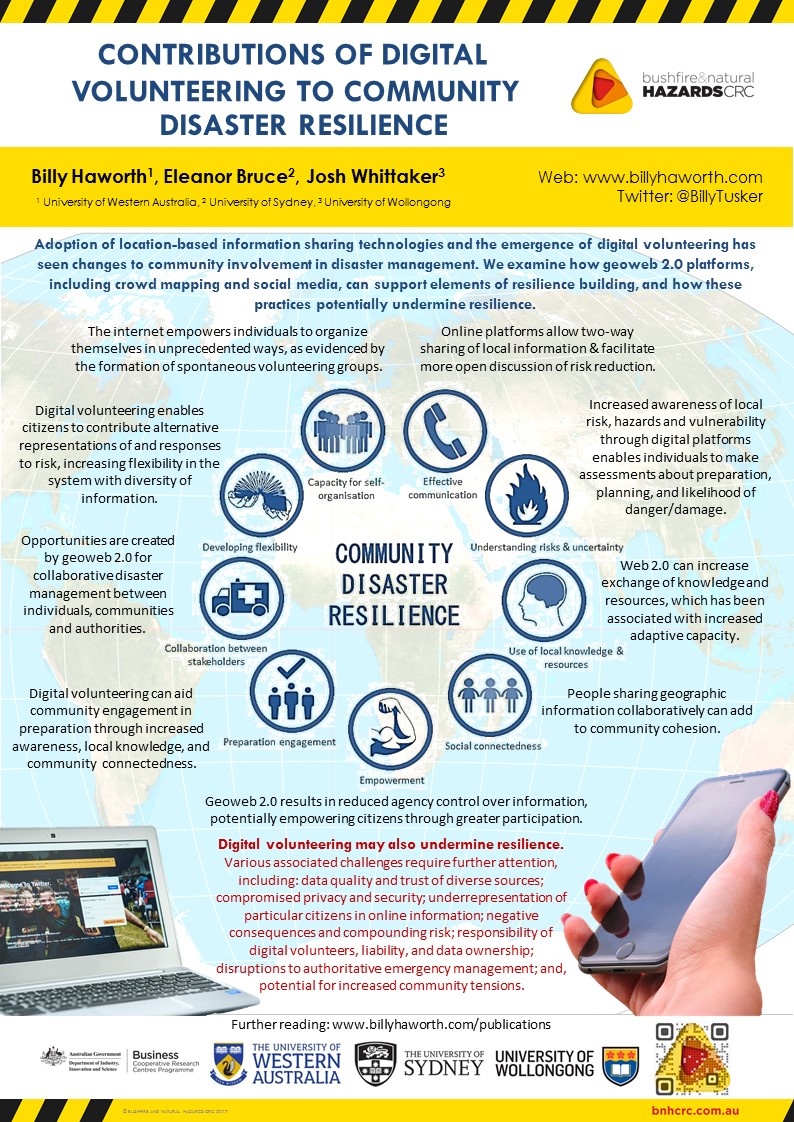
Abstract
The immediacy of locational information requirements and importance of data currency for natural disaster events highlights the value of volunteered geographic information (VGI) in all stages of disaster management, including prevention, preparation, response, and recovery. The practice of private citizens generating online geospatial data presents new opportunities for the creation and dissemination of disaster-related geographic data from a dense network of intelligent observers. VGI technologies enable rapid sharing of diverse geographic information for disaster management at a fraction of the resource costs associated with traditional data collection and dissemination, but they also present new challenges. These include a lack of data quality assurance and issues surrounding data management, liability, security, and the digital divide. There is a growing need for researchers to explore and understand the implications of these data and data practices for disaster management. In this article, we review the current state of knowledge in this emerging field and present recommendations for future research. Significantly, we note further research is warranted in the pre event phases of disaster management, where VGI may present an opportunity to connect and engage individuals in disaster preparation and strengthen community resilience to potential disaster events. Our investigation of VGI for disaster management provides broader insight into key challenges and impacts of VGI on geospatial data practices and the wider field of geographical science.
Introduction
Recent disaster events remind us of the importance of geospatial data and the need for timely and reliable communication in all aspects of disaster management, including prevention, preparation, response and recovery (PPRR). Volunteered geographic information (VGI) provides new opportunities for citizens to create and share geographic information for disaster management. VGI refers to practices of people from the general public creating and sharing their own geographic information, enabled by particular technological advancements, including the growth of Web 2.0, GPS, broadband communication, cloud storage, and mobile devices such as smartphones (see Goodchild 2007).
VGI contributions in disaster management may involve something as simple as somebody posting a relevant photo on social media or it may involve more complex activities, such as the hundreds of volunteers from across the world who worked together using OpenStreetMap to contribute online spatial information for what became the most comprehensive mapping available following the 2010 Haiti earthquake (see Meier 2012).
“A visualisation of the response to the earthquake by the OpenStreetMap community. Within 12 hours the white flashes indicate edits to the map (generally by tracing satellite/aerial photography). Over the following days a large number of additions to the map are made with many roads (green primary, red secondary) added. Also many other features were added such as the blue glowing refugee camps that emerge.” Read more – itoworld.blogspot.com/2010/02/ito-world-at-ted-2010-project-haiti.html
The emergence of VGI has important implications for both individuals and authorities in disaster management, representing numerous opportunities but also significant challenges. In this article we categorize these as being broadly related to data collection and dissemination, data quality and security, data management, and empowerment.
Data Collection and Dissemination
With VGI, the speed and volume of data creation and dissemination has increased dramatically. Information can now be communicated from authorities to communities for disaster management at a fraction of the cost of traditional means of communication. Members of the public can also now create, share, map and communicate information with authorities and with each other in more diverse ways, even if they are not located at the disaster location. As anybody with technology access is now able to contribute, creating disaster related geographic information is no longer just for experts.
The Queensland floods of 2010/2011 saw social media play a critical role, with high numbers of people flooding sites like Facebook and Twitter to share disaster-related information (see Bird, Ling & Haynes 2012). Here, social media facilitated fast and broad information mobility. Posts were re-shared widely, demonstrating the power of social media to promote and propagate messages. This was particularly true for messages of support, but the same mechanisms can also work to spread misinformation or false content.
Rapid uptake of social media during the 2010/11 Queensland floods. Graph produced by Queensland Police Service. “In the 24-hour period following the flash floods, the number of “likes” on the QPS Facebook page increased from approximately 17,000 to 100,000. This same day the QPS Facebook page generated 39 million post impressions, equating to 450 post views per second over the peak 24-hour period.” Read more – https://www.police.qld.gov.au/corporatedocs/reportsPublications/other/Documents/QPSSocialMediaCaseStudy.pdf
Data Quality and Security
Data from private citizens with varying agendas and experience often have quality issues. Studies have reported on important issues of quality control, misinformation, spurious or fraudulent postings, duplicate and doctored images, and the lack of ‘right’ information for disaster relief (see McDougall 2011, Ostermann & Spinsanti 2011). Further, it is often difficult to discern the credibility of online sources. Individual’s physical and online security may be compromised by utilising low-quality VGI. The nature of VGI is that it is often made openly available to the general public. Data of this nature may be particularly compromising during a disaster event, especially when those affected are at their most vulnerable and privacy may be less of a priority than in ‘normal’ circumstances (see Crawford & Finn 2014). For example, a geotagged image of a disaster-impacted property provides useful information to emergency authorities if shared through social media, but that same information about the location of a vulnerable and potentially vacant property may also be available to those with malicious intent. Individuals, authorities and humanitarians should be particularly cautious when using VGI provided through social media (Goolsby 2013), and it should not be assumed that everybody is well informed to manage their own privacy settings online (Crawford & Finn 2014).
Various lines of evidence have been proposed for why the quality of VGI can approach the standards of authoritative data (see Goodchild & Glennon 2010). For example, sites like Wikipedia are proof that crowdsourcing is an effective way to remove errors with large numbers of people reading and verifying information. But how many people are needed for this to be true? And how quickly can information be verified in this way during fast paced emergencies? By its nature user generated content is broadly incomplete, and despite very large volumes of data, bias is not removed. A second example is that advances in positional technology, such as improved GPS in mobile devices, and the increase in familiarity of the public with things like social media, the internet, maps and smartphones means data quality is increased. But this provides no guarantee users consistently operate devices correctly or that they are aware when the technology is not functioning properly. Advances in technology do not necessarily eliminate human error. As researchers continue to seek new applications for these data, innovative methods are needed for empirical validation of the quality and credibility of VGI.
Data Management
Data from the general public presents a number of challenges for data management which are particularly relevant to disaster management. The sheer volume of information provided through VGI is a current obstacle to its efficient use in emergency management, highlighting the need for effective methods to mine, filter, verify, and summarise these data and data sources to ensure credible and relevant content. Various researchers are exploring ways to address this, such as methods to automatically identify relevant key words in Twitter data (Ostermann & Spinsanti 2011). Traditionally, spatial data infrastructures‘ (SDIs) top-down model of supporting digital data access, storage, and sharing is unlike the bottom-up approach on which VGI is established. VGI challenges the assumption that formal organizations are the producers of geospatial information and users are the passive recipients (see Budhathoki, Bruce & Nedovic-Budic 2008). For disaster management, opportunity exists for VGI to augment existing SDIs, providing valuable localised and contextual information for planning decisions and encouraging information flow between communities and authorities.
Due to the higher level of inherent risk to life and property in disaster management decision-making, liability concerns may deter organizations from integrating VGI into their datasets (Shanley, Burns, Bastian & Robson 2013). As websites have a global reach and laws vary widely, liability risks in and across foreign jurisdictions need consideration. VGI site operators, users, and contributors must all have some awareness of the legal and ethical issues that may be triggered by their activities, including issues of intellectual property, liability for faulty information, and defamation (Scassa 2013). Empowerment Through VGI
Empowerment is described as an individual’s capacity to have control over their personal affairs and confront hazard issues while receiving the necessary emergency management support (Bird, Ling & Haynes 2012). It has been argued that VGI empowers individuals to georegister their observations, transmit them through the internet and translate them into readily understood maps and reports (Goodchild & Glennon 2010). But does this indicate VGI can enable individuals to achieve connectedness, more control, and empowerment in disaster management? While VGI may empower some citizens to contribute and engage in disaster management, it also acts to marginalize others. If we consider the digital divide, what is the role of citizens with limiting socio-economic circumstances or those in parts of the world without access to these ‘empowering’ technologies? VGI cannot represent ‘the everybody’ and in fact favours ‘the privileged’, or those with money, access, and time to utilize the technology (see Haklay 2013).
For those that are ‘included’, the use of geospatial data from the crowd has been shown to enhance existing inequalities (see Crawford & Finn 2014). Local information contributed during the 2010 Haiti earthquake crisis was translated into English and subsequently mapped and reported in English, preventing the Kreyòl speakers who messaged for help from benefiting from their own data, thus reproducing unequal power relations between the poor Haitians and the rich who acted on the information (as reported in Crawford & Finn 2014).
Future Research Recommendations
This review highlighted a number of gaps in current academic research around VGI and disaster management. It is recommended that future research consider:
best practices for emergency management agencies to support digital volunteers, and for digital volunteers to support traditional and authoritative disaster management practices
the role of different types of VGI platforms during disasters and comparisons between different types of disasters and whether or not the disaster type has any influence on VGI usage
improving data validation and automatic report summation
more appropriate use of VGI technologies, including geotags (adding location information to online data) and effective hashtags for summarising social media data
VGI in the preparation and prevention phases of disaster management. This review shows that contemporary research on the role of VGI in disaster management predominantly focuses on the response phase of the PPRR cycle. Directing increased attention to the pre-disaster phases may present an opportunity for VGI to foster community engagement and empower individuals to be more directly involved in risk reduction practices.
There is a need for further research on the technical and critical dimensions of VGI and for human geographers to engage with GIScientists to comprehend the implications of these data and data practices for citizens, traditional methods of disaster management, and geography as a discipline more broadly.
Recently I attended the Association of American Geographers 2015 annual meeting in Chicago, IL, along with several thousand other “geographers” from around the world. Being the largest academic geography conference in the world, even navigating the program was a little overwhelming with over 6000 items, let alone the event itself. But that volume of presenters also means a lot of interesting research, and this post attempts to document some of that. I won’t be listing everything I experienced, but rather just summarising some of my highlights from the week.
Tuesday April 21
First up on the first day was my own presentation, as part of the session Advances in Geospatial Emergency Management, organised by Professor Matt Duckham at the University of Melbourne (one of my associate supervisors) and Professor Mark Horner at Florida State University.
My paper, Engaging Communities in Disaster Risk Reduction through Volunteered Geographic Information: A case study of bushfires (wildfires) in Tasmania, Australia, was really a broad overview of my PhD research. The paper described how VGI represents shifts in the way geospatial information is produced, shared, used, and experienced, resulting in changes to social practices, top-down approaches to mapping and information dissemination, and the broader disciplines of geography and GIScience, with significant implications for various applications, including emergency management. This research considers the potential of VGI to transform disaster management by thinking about VGI as a social practice and not simply a type of information. This leads to thinking about change in cultural practices in emergency management away from authoritative top-down systems. Giving power to citizens through VGI aids in sustaining community involvement in disaster management, changing behaviours, and ultimately increasing disaster resilience. The paper called for a need to critically assess the role of VGI in the important disaster management phase of preparedness by emphasizing the majority of research in this field to date has only considered disaster response. The research presented focused on VGI for increasing bushfire preparation engagement in Tasmania, outlining key research methods, such as community surveys, interviews with emergency management professionals, and community participatory mapping workshops, along with some preliminary findings.
In the same session I found the impromptu presentation by Matt Duckham on some of the work from his RISER (Resilient Information Systems for Emergency Response) project very interesting. Matt argued that in a time of increased looking to social media for crowdsourced information in disaster management, there are other sources of information from that crowd that are both highly useful and sometimes perhaps more reliable. He noted that in the event of bushfire actually finding the exact location of the fire can be a real challenge, and demonstrated a model that predicted fire locations using crowdsourced data in the form of calls to the emergency services with impressive accuracy. There is a special journal issue in ‘Computers, Environment & Urban Systems’ calling for papers that accompanies this session. More details and submission information can be found here.
Later in the day the panel session, CyberGIS symposium: frontiers of Big Data and urban informatics, chaired by Vonu Thakuriah of the Urban Big Data Centre, raised some interesting questions around the benefits and challenges of big data, researching with big data and theory versus data driven models, privacy, the aggregation of data and industry ownership, and democratization and the notion of an open data economy.
Wednesday April 22
In the morning session Analysing resilience through disaster response, risk perception and risk communication,research in Portugal showed emergency authorities to be under-prepared for ‘lower risk’ emergencies, such as hail and lightning strikes (as opposed to floods, earthquakes etc), with significant negative implications for affected communities. PhD research modelling the coverage and response times of fire services in a province of Ghana was presented, using GIS to improve the efficiency and effectiveness of existing systems while trying to predict where new fire stations should be most strategically positioned to best serve the communities in the area. What was striking in this paper to me was the difficulties associated with obtaining data in particular countries in the world, such as Ghana. The concept of tipping points in resilience theory was described by Rafael Calderón-Contreras,where at a particular point a system will either cope with stress and remain the same or change to a new state. Resilience, being ‘ready’ for disaster, and failures of authorities were common themes in this session.
BikeMaps has citizens contribute their local cycling knowledge (hazards, theft, accidents, near-misses etc) and then analyses and visualizes the data with the aim to make biking safer. The project seems highly useful and is gaining interest in places all over the world. They’ve employed some pretty fun engagement strategies, with my favourite being placing BikeMaps branded drink bottles on 500 parked bikes across the city for unsuspecting cyclists to find when they return to their bikes (information on the project and how to contribute is included inside the bottle).
The Vespucci reunion – Photo credit Cheli Cressell
The other highlight of the day was a Vespucci reunion over lunch with Muki Haklay, Victoria Fast, Cheli Cresswell, Cristina Capineriand Antonello Romano. I met these guys at a summer school on VGI and Citizen Science in Italy last July so it was great to see everyone and learn how they’re doing with their research. Thursday April 23
I attended an Esri workshop on teaching Web GIS. The workshop provided a guide for teaching Web GIS in classrooms. It was interesting and useful in thinking about my current teaching as a GIS tutor and for when I may be writing courses myself one day. But it was also just really interesting for myself to be exposed to a whole range of new platforms and possibilities for GIS mapping provided through Esri and ArcGIS online that I had never really explored before. Things like making interactive web maps, custom and mobile applications, easy ways for the public to contribute volunteered geographic information, and the general simplicity and quality of some of the online tools. I started to rethink how I make my maps now and got pretty excited about revisiting some of my past projects with these new tools, as well as what new projects could be possible. Really cool!
The panel session New Directions in Mapping: Open Source, Crowd-sourcing and “Big Data” chaired by Matthew Zookraised some interesting debates. How do we define ‘open’ and is it the same in theory and implementation? What implications might an increase in the ubiquity of mapping and the use of passive data have for expert geography and expert map-makers? What about those citizens not represented in the ‘crowd’? Are the gaps in crowd data more in content than in space? Probably both. Those with the loudest voices have their issues heard more (and therefore their content mapped) excluding ‘smaller’ problems (smaller in terms of voice, not importance), and there are gaps in space, E.g. how does the crowd map private land? What does opting-in mean when you can’t use a service unless you agree to terms of service? Opting-in implies there should be more control over choice than that doesn’t it? Will people opting-out become an issue for applications relying on crowd data?
How do crowd data and authoritative data compare on quality? It was argued in the panel that all data has issues, it’s just that this is recognised and accepted in crowd data.
Friday April 24 Friday was mostly taken up by sessions run by Muki Haklay around motivation and enthusiasm in citizen science, and around OpenStreetMap studies (the online public mapping platform recently celebrated it’s 10th Birthday). Britta Rickerspoke about the use of drones for motivating students into science work. Drones bridge the gap between the imagery needed for science over smaller spatial scales and the spatial and temporal limitations of pubic satellite data. People seem genuinely excited by drones, but we need to also remember why are we using them (why is a drone needed for the research objective etc). I wondered if the increased engagement with the technology also extended to increased quality of learning for the students – a point I think relevant to my work on exploring the use of VGI technologies for increasing community engagement in bushfire preparation. In a project on conservation and hunting lion fish in the Caribbean, Brittany Davis then spoke about balancing participant’s enthusiasm to hunt the animal for recreation with enthusiasm to participate in the science with collection of accurate and useful data and the overall aim of conservation. For many in this study it seemed the motivation for participating was the access for them to kill the fish, not the important data collection.
Muki Haklay gave a talk on OpenStreetMap, thinking about how it relates to VGI and to citizen science. He has provided the slides from his talk here. I thought it was very thought provoking and I will end this post with a few points I took away from his talk:
Academics needs to be a “critical friend” to projects like OpenStreetMap, they need to be realistic about projects, and they need to learn from each other
Projects like OpenStreetMap and other VGI or citizen science projects are not just about the data – they are a social practice
In order to best understand you need to do the project yourself, not just study from the outside – participatory research
In regards to open research, even if your work can’t be in an open access journal, you can still make it accessible and visible through other means, such as by posting a summary on a blog.
Muki also showed a video (below) made to portray some of the research associated with COST Energic around VGI and indigenous communities. I won’t describe the video too much as you can just watch for yourself if you wish. But I will say it’s a nice video with some very interesting work and I recommend giving it a look.
And so that was some of my highlights of the AAG 2015. Overall I found the experience very rewarding. Being from Australia where much of the research I’m interested in is not so big, particularly around emerging geospatial technologies for community engagement in science, new mapping directions and ‘big data’, and more generally VGI and citizen science studies, meant the conference was particularly giving for me with a vast amount of research being presented in these fields. For emergency management it was somewhat disappointing and encouraging at the same time to see researchers all over the world are grappling the same kinds of questions and challenges in disaster management, namely around resilience building and tensions between community activities, emergent technological solutions, and traditional authoritative emergency management practices. I had my first experience presenting my work internationally, I learnt about a lot of interesting projects, and I fostered existing research connections and made some new ones. What’s more, I got to experience the fantastic city of Chicago! I may have a sore neck from looking up at all the beautiful big buildings, but that’s okay, because the late night jazz, deep dish pizza and seeing the Chicago Bulls win in the NBA playoffs all make up for that! Now, here is a picture of me with the bean:
Self portrait with Cloud Gate in Millennium Park, Chicago.
The Water Services Sector Group’s Social Media Conference was recently held in Sydney and I had the pleasure of attending. With a focus on crisis management and disaster response, a number of key speakers from various parts of the world shared their insights and experiences in the growing field of social media, which all agreed is now an undeniably important component of modern society. Melanie Irons spoke of the pivotal role of social media in mobilising a community through her Facebook page in response to the 2013 Tasmania bushfires. Suzanne Bernier used examples such as the ‘Yes we can’ Obama campaign and ‘Domino’s Pizza Scandal’ YouTube videos to illustrate the role of social media in shaping the reputation of individuals and organizations, demonstrating the impact social media use can have to define, destroy, or strengthen during crisis scenarios. Caroline Milligandescribed the concept of a ‘Virtual Operations Support Team’ with key events such as the London 2012 Olympics or Hurricane Sandy having much of their social media crisis preparation and response performed virtually by her team based in New Zealand. And Charlie Hawkinsdemonstrated some of the latest social media harnessing and visualization tools developed by the CSIRO. While shortcomings were noted, such as the need for report verification, rumour control and negative posts, the overall consensus was the positive attributes of social media use in crisis management, such as the facilitation of coordination and collaboration, speed of information transfer, bi-directional communication and individual empowerment, far outweighed the negative. The message of the day was clear: social media is here to stay. It needs to be incorporated into emergency management strategies and policy in order to foster the most effective collaboration between connected communities and official information sources. The general public now expect authorities and organizations to be active on social media. How organizations respond to this expectation and how they conduct themselves by involving (or not involving) themselves in social media conversations can directly impact their perceived credibility and overall effectiveness both in disaster situations, and in public more broadly.


![_SFL6626[1]](https://billyhaworth.files.wordpress.com/2019/04/sfl66261.jpg?w=984&h=656)
![_SFL6567[1]](https://billyhaworth.files.wordpress.com/2019/04/sfl65671.jpg?w=984&h=656)
![_SFL6560[1]](https://billyhaworth.files.wordpress.com/2019/04/sfl65601.jpg?w=984)
![_SFL6517[1].jpg](https://billyhaworth.files.wordpress.com/2019/04/sfl65171.jpg?w=984)