This article originally appeared in The Conversation.
Billy Tusker Haworth, University of Manchester, Christine Eriksen, University of Wollongong, Scott McKinnon, University of Wollongong
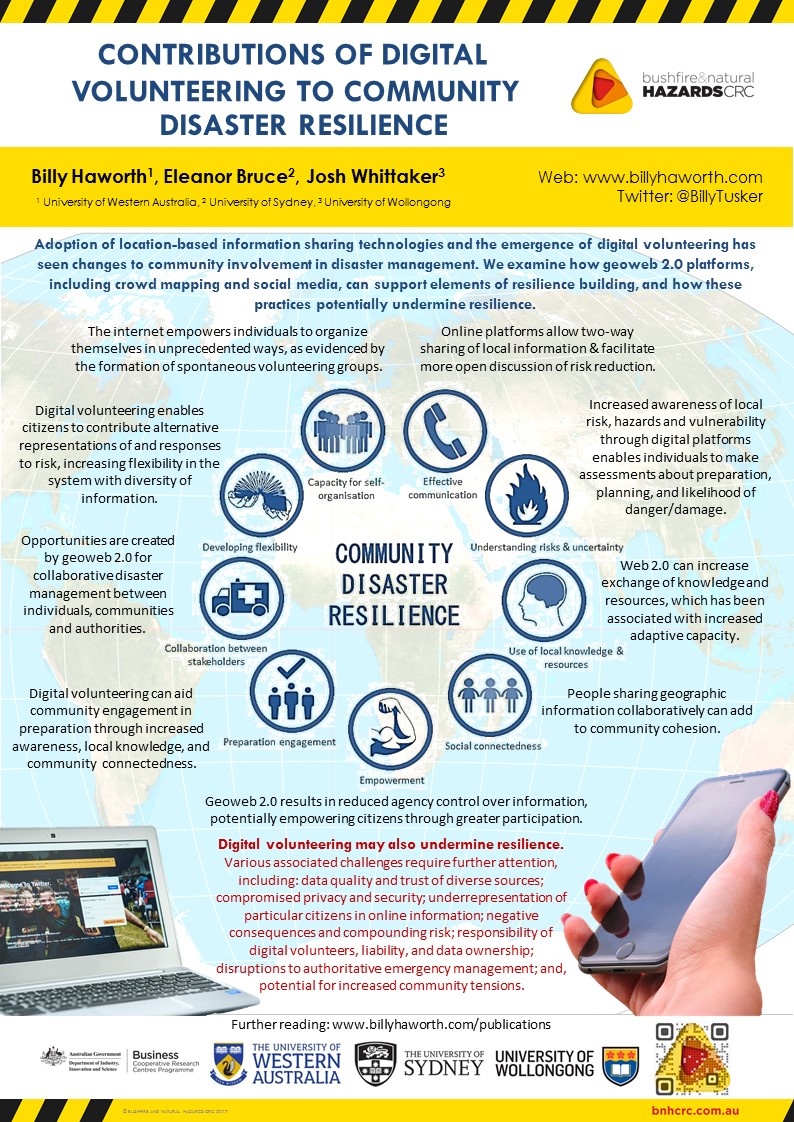
With natural hazard and climate-related disasters on the rise, online tools such as crowdsourced mapping and social media can help people understand and respond to a crisis. They enable people to share their location and contribute information.
But are these tools useful for everyone, or are some people marginalised? It is vital these tools include information provided from all sections of a community at risk.
Current evidence suggests that is not always the case.
Online tools let people help in disasters
Social media played an important role in coordinating response to the 2019 Queensland floods and the 2013 Tasmania bushfires. Community members used Facebook to coordinate sharing of resources such as food and water.
Crowdsourced mapping helped in response to the humanitarian crisis after the 2010 Haiti earthquake. Some of the most useful information came from public contributions.
Twitter provided similar critical insights during Hurricane Irma in South Florida in 2017.
Research shows these public contributions can help in disaster risk reduction, but they also have limitations.
In the rush to develop new disaster mitigation tools, it is important to consider whether they will help or harm the people most vulnerable in a disaster.
Who is vulnerable?
Extreme natural events, such as earthquakes and bushfires, are not considered disasters until vulnerable people are exposed to the hazard.
To determine people’s level of vulnerability we need to know:
- the level of individual and community exposure to a physical threat
- their access to resources that affect their capacity to cope when threats materialise.
Some groups in society will be more vulnerable to disaster than others. This includes people with immobility issues, caring roles, or limited access to resources such as money, information or support networks.
When disaster strikes, the pressure on some groups is often magnified.
The devastating scenes in New Orleans after Hurricane Katrina in 2005 and in Puerto Rico after Hurricane Maria in 2017 revealed the vulnerability of children in such disasters.
Unfortunately, emergency management can exacerbate the vulnerability of marginalised groups. For example, a US study last year showed that in the years after disasters, wealth increased for white people and declined for people of colour. The authors suggest this is linked to inequitable distribution of emergency and redevelopment aid.
Policies and practice have until recently mainly been written by, and for, the most predominant groups in our society, especially heterosexual white men.
Research shows how this can create gender inequities or exclude the needs of LGBTIQ communities, former refugees and migrants or domestic violence victims.
We need to ask: do new forms of disaster response help everyone in a community, or do they reproduce existing power imbalances?
Unequal access to digital technologies
Research has assessed the “techno-optimism” – a belief that technologies will solve our problems – associated with people using online tools to share information for disaster management.
These technologies inherently discriminate if access to them discriminates.
In Australia, the digital divide remains largely unchanged in recent years. In 2016-17 nearly 1.3 million households had no internet connection.
Lower digital inclusion is seen in already vulnerable groups, including the unemployed, migrants and the elderly.
Global internet penetration rates show uneven access between economically poorer parts of the world, such as Africa and Asia, and wealthier Western regions.
Representations of communities are skewed on the internet. Particular groups participate with varying degrees on social media and in crowdsourcing activities. For example, some ethnic minorities have poorer internet access than other groups even in the same country.
For crowdsourced mapping on platforms such as OpenStreetMap, studies find participation biases relating to gender. Men map far morethan women at local and global scales.
Research shows participation biases in community mapping activities towards older, more affluent men.
Protect the vulnerable
Persecuted minorities, including LGBTIQ communities and religious minorities, are often more vulnerable in disasters. Digital technologies, which expose people’s identities and fail to protect privacy, might increase that vulnerability.
Unequal participation means those who can participate may become further empowered, with more access to information and resources. As a result, gaps between privileged and marginalised people grow wider.
For example, local Kreyòl-speaking Haitians from poorer neighbourhoods contributed information via SMS for use on crowdsourced maps during the 2010 Haiti earthquake response.
But the information was translated and mapped in English for Western humanitarians. As they didn’t speak English, vulnerable Haitians were further marginalised by being unable to directly use and benefit from maps resulting from their own contributions.
Participation patterns in mapping do not reflect the true makeup of our diverse societies. But they do reflect where power lies – usually with dominant groups.
Any power imbalances that come from unequal online participation are pertinent to disaster risk reduction. They can amplify community tensions, social divides and marginalisation, and exacerbate vulnerability and risk.
With greater access to the benefits of online tools, and improved representation of diverse and marginalised people, we can better understand societies and reduce disaster impacts.
We must remain acutely aware of digital divides and participation biases. We must continually consider how these technologies can better include, value and elevate marginalised groups.
____________________________________________________________________________________________
Christine Eriksen
Senior Lecturer in Geography and Sustainable Communities, University of Wollongong


